

America didn’t just lose traffic during the pandemic. It lost cars, millions of them.
Between 2019 and 2023, more than 11.6 million registered vehicles effectively disappeared from U.S. roads. That’s not a rounding error or a statistical blip. It’s a structural shift, one large enough to erase every registered vehicle in multiple mid-sized states combined.
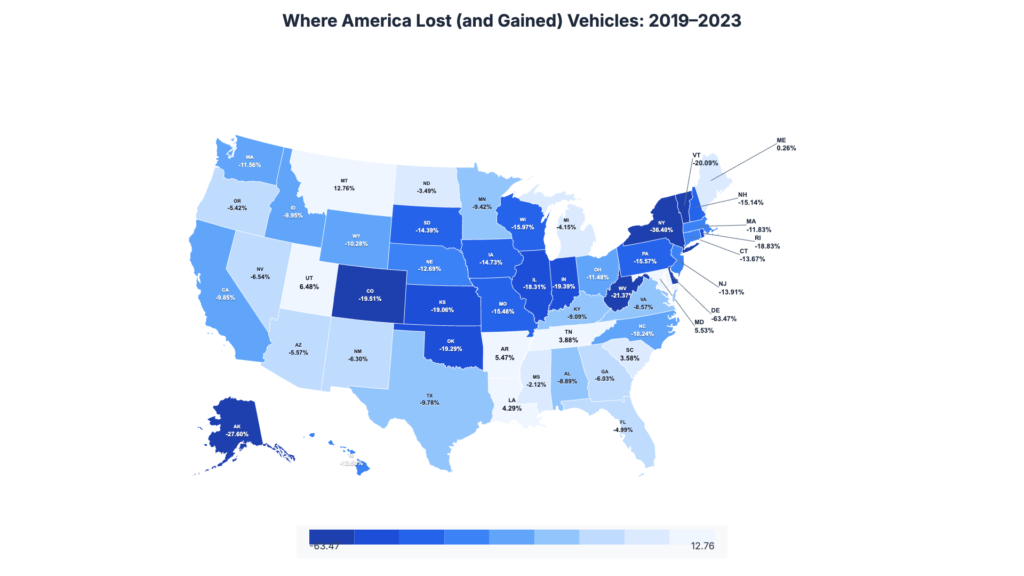
But the decline wasn’t universal.
While much of the country saw registrations contract, a small cluster of states quietly moved in the opposite direction. In places like Montana and Utah, vehicle counts grew. In others, most notably New York and Delaware, registrations collapsed at rates that defy typical economic cycles.
What explains the divergence? Population migration. Remote work. Insurance costs. Urban flight. Changes in commuting habits. Rising vehicle prices. The answer is likely a mix of all of it.
The data reveals a country reshuffling not just where people live, but how, and whether, they drive. Some states are adding vehicles at double-digit rates. Others are shedding them by the hundreds of thousands.
The following analysis breaks down which states are gaining cars, which are losing them, and what the numbers suggest about the broader transformation of American mobility.
Key Findings
- Montana leads all 50 states with 12.76% auto registration growth from 2019 to 2023, adding 56,050 vehicles while 42 states experienced declines.
- Only 8 states posted positive growth: Montana, Utah (6.48%), Maryland (5.53%), Arkansas (5.47%), Louisiana (4.29%), Tennessee (3.88%), South Carolina (3.58%), and Maine (0.26%).
- Delaware recorded the steepest decline at -63.47%, while New York lost the most vehicles in absolute terms (-1,617,754), a 36.40% drop over four years.
While much of America watched vehicle registrations slide, a handful of states bucked the trend. Montana emerged as the unlikely leader, posting double-digit growth as neighboring states shed hundreds of thousands of vehicles from their roads.
The study, conducted by RoadRunner Auto Transport, analyzed USDOT Motor Vehicle Registration data (MV-1 series) across all 50 states, comparing 2019 baseline figures against 2023 registrations to calculate both percentage and absolute growth.
Top 10 U.S. States by Percent Growth (2019-2023)
| Rank | State | 2019 | 2023 | % Growth |
| 1 | Montana | 439,118 | 495,168 | +12.76% |
| 2 | Utah | 921,645 | 981,361 | +6.48% |
| 3 | Maryland | 1,868,994 | 1,972,390 | +5.53% |
| 4 | Arkansas | 886,647 | 935,148 | +5.47% |
| 5 | Louisiana | 1,349,720 | 1,407,575 | +4.29% |
| 6 | Tennessee | 2,185,229 | 2,269,998 | +3.88% |
| 7 | South Carolina | 1,801,243 | 1,865,739 | +3.58% |
| 8 | Maine | 373,868 | 374,850 | +0.26% |
| 9 | Mississippi | 806,061 | 789,001 | -2.12% |
| 10 | North Dakota | 228,881 | 220,884 | -3.49% |
Montana’s 12.76% surge represents the most aggressive vehicle growth in the nation, nearly double the second-place state. The top seven states all posted positive growth, with Southern and Mountain West states dominating the leaderboard. Maine barely held positive territory at 0.26%, while Mississippi and North Dakota round out the top 10 despite modest declines. Notably, six of the eight states with positive growth are in the South or Mountain West, regions experiencing population influx and economic expansion.
10 U.S. States Losing the Most Vehicle Registrations (2019-2023)
| Rank | State | 2019 | 2023 | % Decline |
| 50 | Delaware | 423,462 | 154,675 | -63.47% |
| 49 | New York | 4,444,391 | 2,826,637 | -36.40% |
| 48 | Alaska | 178,516 | 129,249 | -27.60% |
| 47 | West Virginia | 536,646 | 421,961 | -21.37% |
| 46 | Vermont | 206,621 | 165,119 | -20.09% |
| 45 | Colorado | 1,741,218 | 1,401,569 | -19.51% |
| 44 | Indiana | 2,185,979 | 1,762,180 | -19.39% |
| 43 | Oklahoma | 1,255,134 | 1,013,005 | -19.29% |
| 42 | Kansas | 947,148 | 766,581 | -19.06% |
| 41 | Rhode Island | 396,508 | 321,829 | -18.83% |
Delaware’s 63.47% plunge represents the most dramatic contraction in the nation, dropping from 423,462 to just 154,675 registered vehicles. New York’s 36.40% decline erased over 1.6 million registrations, the largest absolute loss nationwide. The bottom ten is dominated by Northeastern and smaller states. Colorado’s presence in this group is notable given its reputation as a growth state, suggesting that raw population growth doesn’t always translate to vehicle registration increases.
10 U.S. States Shedding the Most Vehicles (2019-2023)
| Rank | State | Vehicles Lost | 2023 Total | % Change |
| 1 | New York | -1,617,754 | 2,826,637 | -36.40% |
| 2 | California | -1,466,851 | 13,428,061 | -9.85% |
| 3 | Texas | -812,696 | 7,500,927 | -9.78% |
| 4 | Illinois | -791,378 | 3,531,472 | -18.31% |
| 5 | Pennsylvania | -664,659 | 3,603,152 | -15.57% |
| 6 | Ohio | -507,818 | 3,915,430 | -11.48% |
| 7 | Indiana | -423,799 | 1,762,180 | -19.39% |
| 8 | Florida | -391,638 | 7,449,551 | -4.99% |
| 9 | New Jersey | -367,129 | 2,272,132 | -13.91% |
| 10 | North Carolina | -351,586 | 3,082,979 | -10.24% |
When measured in raw vehicle counts, the nation’s most populous states dominate the loss column. New York and California alone shed over 3 million registrations combined, equivalent to erasing every vehicle in Montana and Utah more than twice. These ten states collectively lost 7.4 million vehicle registrations, accounting for nearly 64% of the national decline. Florida’s relatively modest 4.99% decline still translates to nearly 400,000 fewer vehicles, demonstrating how percentage rates can mask the true scale of change in high-volume states.
Average Percent Change by U.S. Region (2019-2023)
| Region | States | Avg. % Change | Top Performer |
| Southeast | 14 | -8.00% | Maryland (+5.53%) |
| West | 11 | -8.55% | Montana (+12.76%) |
| Southwest | 4 | -10.23% | Arizona (-5.57%) |
| Midwest | 12 | -13.21% | North Dakota (-3.49%) |
| Northeast | 9 | -16.13% | Maine (+0.26%) |
The Southeast emerged as the most resilient region, posting the smallest average decline at 8.00%. The region benefits from population migration patterns and economic growth across states like Tennessee, South Carolina, and Maryland. The Northeast suffered the steepest regional decline at 16.13%, dragged down by catastrophic losses in New York and Delaware. Notably, even the best-performing regions posted negative averages, underscoring that vehicle registration declines are a nationwide phenomenon rather than a regional anomaly.
U.S. Vehicle Registration Trends at a Glance
| Metric | Value |
| States analyzed | 50 |
| Time period | 2019-2023 |
| Total registrations (2019) | 108,343,935 |
| Total registrations (2023) | 96,725,207 |
| Net national change | -11,618,728 |
| National percent change | -10.72% |
| States with positive growth | 8 |
| States with negative growth | 42 |
| Highest growth (Montana) | +12.76% |
| Steepest decline (Delaware) | -63.47% |
| Largest absolute gain (Maryland) | +103,396 vehicles |
| Largest absolute loss (New York) | -1,617,754 vehicles |
Methodology
Study Overview
RoadRunner Auto Transport analyzed official motor vehicle registration data from the U.S. Department of Transportation to identify which states experienced the fastest and slowest growth in registered vehicles between 2019 and 2023.
Data Collection Process
Primary Data Source: USDOT Open Data Portal – Motor Vehicle Registrations, 1900-2023 (MV-1, wide format). This dataset is compiled from the Federal Highway Administration’s annual MV-1 series, which aggregates state-reported vehicle registration figures.
Geographic Scope: All 50 U.S. states
Time Period: 2019-2023 (selected to avoid over-weighting 2020 pandemic-year anomalies in year-over-year calculations)
Calculation Methodology
Absolute Growth: Calculated as Registrations_2023 minus Registrations_2019 for each state.
Percent Growth: Calculated as ((Registrations_2023 / Registrations_2019) – 1) x 100.
Ranking: States were ranked by percent growth (primary metric), with secondary analysis by absolute growth for large-state context.
Quality Assurance
All 50 states were verified to have complete registration data for both 2019 and 2023. Outliers were flagged and cross-referenced against source data to ensure accuracy. Regional classifications follow U.S. Census Bureau definitions.