

KEY HIGHLIGHTS
- Vermont tops the Injury Cliff Index at 192.82 out of 300, leading all three dimensions with 25.40% of residents on Social Security and 6.14% of workers aged 65+.
- Texas ranks 18th overall but records the highest fatal injury figure for workers 65+ at 134, alongside 4.80 million Social Security beneficiaries, the third largest in the country.
- 66.77 million Americans across the 50 states receive OASDI benefits, equal to 19.67% of the represented population, per SSA 2024 State Statistical Supplements.
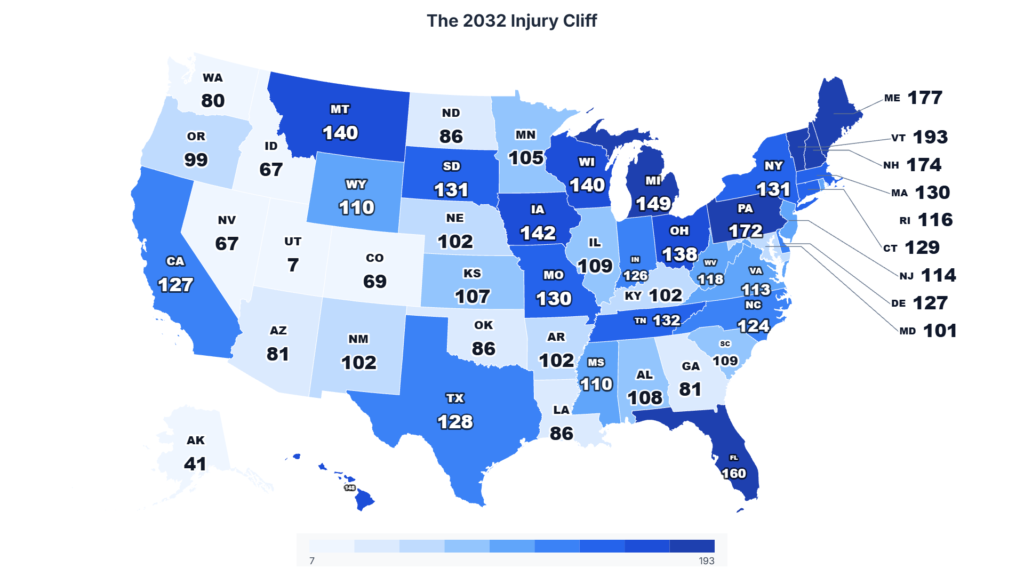
With the Congressional Budget Office’s March 2026 update reaffirming a 2032 depletion date for the Social Security Old-Age and Survivors Insurance trust fund, attention has shifted to identifying states least prepared for retirees potentially re-entering the workforce.
According to an analysis by Ladah Injury & Car Accident Lawyers Las Vegas, the Injury Cliff Index equally weights three variables drawn from the Social Security Administration’s 2024 OASDI State Statistical Supplements, the US Census Bureau’s American Community Survey Table B23001, and the US Bureau of Labor Statistics’ 2024 Census of Fatal Occupational Injuries. Each variable is min-max normalized to a 0 to 100 scale, then summed into a 0 to 300 composite.
Vermont Tops the 50-State Injury Cliff Index With a Composite Score of 192.82
| Rank | State | % on Social Security | % of Workforce Aged 65+ | Fatal Injury Rate, Workers 65+ | Composite Score |
| 1 | Vermont | 25.40% | 6.14% | 7 | 192.82 |
| 2 | Maine | 26.75% | 5.44% | 4 | 176.76 |
| 3 | New Hampshire | 24.35% | 5.97% | Not reported* | 174.13 |
| 4 | Pennsylvania | 22.80% | 4.64% | 73 | 172.15 |
| 5 | Florida | 22.09% | 4.51% | 70 | 160.28 |
| 6 | Michigan | 23.07% | 3.90% | 73 | 149.09 |
| 7 | Hawaii | 20.92% | 5.87% | 3 | 147.84 |
| 8 | Iowa | 21.63% | 4.49% | 51 | 142.10 |
| 9 | Montana | 23.24% | 5.04% | 8 | 140.43 |
| 10 | Wisconsin | 22.91% | 4.14% | 51 | 139.58 |
Vermont leads because it ranks in the top tier on every input: the third-highest Social Security dependency, the highest share of workers aged 65 and over, and a reported fatal injury figure that registers rather than being suppressed. Maine follows with the highest Social Security dependency in the top tier at 26.75%, coupled with a reported fatal injury count, which together lift it above states with higher fatality figures but fewer seniors in the workforce.
Looking at the study, Ramzy Ladah, Founder & CEO of Ladah Injury & Car Accident Lawyers, Las Vegas, commented.
“These numbers line up uncomfortably. The states most reliant on Social Security are often the same states with the oldest workers still on the job, and in several of them, that work can be fatal. If they reduce benefits in 2032, people already exposed will face pressure to keep working.”
Texas Records the Highest Fatal Injury Figure for Senior Workers in the Dataset at 134
| Rank | State | Fatal Injury Rate, Workers 65+ (2024) |
| 1 | Texas | 134 |
| 2 | California | 104 |
| 3 | Pennsylvania | 73 |
| 4 | Michigan | 73 |
| 5 | Florida | 70 |
Four of these five states also rank among the largest senior beneficiary populations in the country, with California, Florida, Texas, and Pennsylvania all appearing in the national top five for OASDI enrollment. That combination concentrates both exposure and consequence: the places with the most retirees to be affected by a 2032 benefit reduction are also the places with the highest recorded workplace fatalities among workers 65 and over.
West Virginia Leads Social Security Dependency at 27.09% of Population
| Rank | State | % of Population Receiving OASDI (2024) |
| 1 | West Virginia | 27.09% |
| 2 | Maine | 26.75% |
| 3 | Vermont | 25.40% |
| 4 | New Hampshire | 24.35% |
| 5 | Mississippi | 23.77% |
The Northeast and Appalachia dominate this list, a clustering that reflects both older demographics and lower median incomes in those regions. West Virginia does not appear in the composite top 10 because its share of workers aged 65 and over is comparatively low, meaning fewer of its Social Security recipients are currently in the workforce.
Utah Ranks Least Vulnerable With a Composite Score of 6.72
| Rank | State | Composite Score (out of 300) |
| 46 | Colorado | 68.71 |
| 47 | Idaho | 67.40 |
| 48 | Nevada | 66.65 |
| 49 | Alaska | 40.52 |
| 50 | Utah | 6.72 |
These states score low primarily because of younger workforces and below-average Social Security dependency rather than because their workplaces are demonstrably safer. Because the BLS suppressed Idaho’s fatal injury figure and treated it as the minimum value for normalization purposes, its low composite score does not show workplace safety.
Methodology
The Injury Cliff Index equally weights three variables, each min-max normalized across the 50-state range to a 0 to 100 scale and summed into a 0 to 300 composite. Social Security dependency is OASDI beneficiaries from the SSA’s 2024 State Statistical Supplements divided by the 2024 US Census Bureau state population estimates. The senior workforce share comes from the US Census Bureau ACS Table B23001. The BLS 2024 Census of Fatal Occupational Injuries state tables provide the fatal occupational risk for workers 65 and over. BLS suppressed six state cells for the fatal injury variable: New Hampshire, Delaware, Rhode Island, New Mexico, Louisiana, and Idaho. For normalization purposes only, we scored these suppressed cells with the minimum value, potentially understating the true vulnerability in those states.