

Key Findings:
- Most Vulnerable Jurisdictions: States with extreme asylum ratios and minimal ICE staffing face near-total operational collapse, exceeding 40-point burden scores.
- Regional Aspect: The Northeast concentrates asylum burden while the Upper Midwest faces airport infrastructure constraints, forming two distinct crisis zones.
- Least Vulnerable Jurisdictions: Federal administrative centers and low-population states score below 5, retaining capacity to absorb expanded responsibilities.
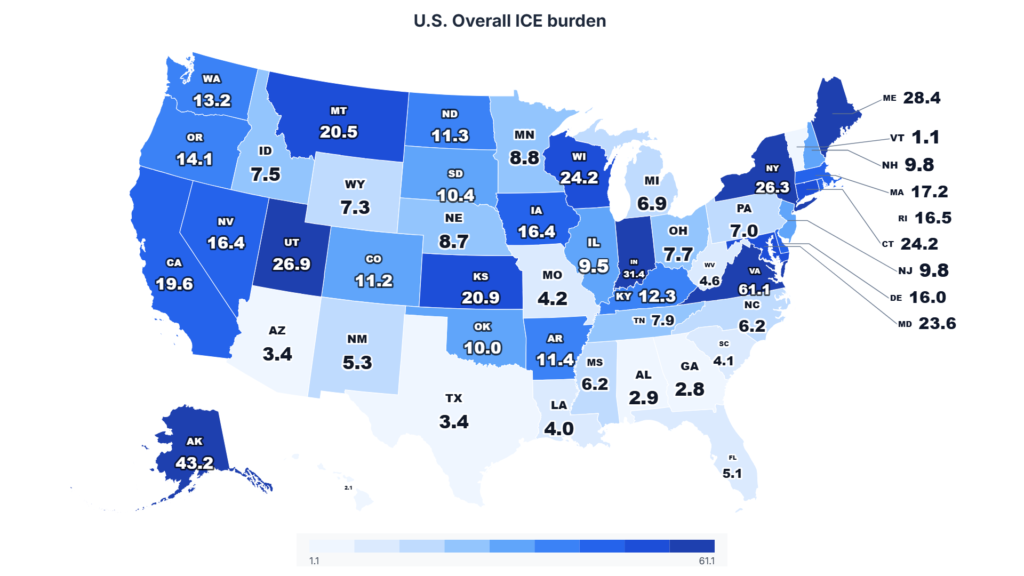
Federal enforcement strain is highly concentrated geographically. Around 20 percent of U.S. jurisdictions carry 46 percent of the national burden under airport security expansion scenarios. The top 15 jurisdictions, about 29 percent of all, absorb 59 percent of the burden. Several states already show staffing-to-responsibility ratios that indicate operations are strained even before any expansion.
The study conducted by The Mendoza Law Firm draws on three federal data sources, OPM ICE staffing (2026), DHS asylum statistics (2023), and FAA airport records, standardized to per-100,000-employee ratios. Burden metrics were converted to 0-100 scales and weighted 60/40 reflecting ICE’s asylum versus airport security priorities, revealing operational strain independent of state population or staffing size.
Primary Finding: Overall ICE Burden Score Rankings
| Rank | Jurisdiction | ICE Employees 2026 | Asylees 2023 | Airports | Overall Burden Score | Primary Driver |
|---|---|---|---|---|---|---|
| 1 | Virginia | 266 | 3,210 | 64 | 61.1 | Extreme asylum burden (60/100) |
| 2 | Alaska | 31 | 20 | 283 | 43.2 | Extreme airport burden (40/100) |
| 3 | Indiana | 104 | 570 | 99 | 31.4 | High asylum burden (27.25/100) |
| 4 | Maine | 46 | 220 | 48 | 28.4 | Moderate asylum burden (23.78/100) |
| 5 | Utah | 226 | 1,180 | 48 | 26.9 | High asylum burden (25.96/100) |
| 6 | New York | 1,864 | 9,740 | 116 | 26.3 | Very high asylum burden (25.98/100) |
| 7 | Connecticut | 57 | 260 | 20 | 24.2 | Moderate asylum burden (22.68/100) |
| 8 | Wisconsin | 59 | 180 | 121 | 24.2 | Balanced burden (15.17 asylum / 8.99 airport) |
| 9 | Maryland | 426 | 1,990 | 32 | 23.6 | Very high asylum burden (23.23/100) |
| 10 | Kansas | 43 | 50 | 148 | 20.9 | Balanced burden (5.78 asylum / 15.08 airport) |
| 11 | Montana | 36 | 40 | 123 | 20.5 | Balanced burden (5.52 asylum / 14.97 airport) |
| 12 | California | 3,458 | 13,400 | 242 | 19.6 | Very high absolute asylum burden (19.27/100) |
| 13 | Massachusetts | 484 | 1,640 | 37 | 17.2 | High asylum burden (16.85/100) |
| 14 | Rhode Island | 47 | 150 | 7 | 16.5 | Moderate asylum burden (15.87/100) |
| 15 | Iowa | 64 | 110 | 115 | 16.4 | Balanced burden (8.55 asylum / 7.87 airport) |
The top 15 jurisdictions employ only 24.2 percent of the nation’s ICE workforce yet would absorb 59 percent of national operational burden under expansion scenarios. Virginia’s burden score exceeds Alaska’s by 41 percent, indicating singular vulnerability concentration rather than distributed strain across multiple jurisdictions.
Secondary Finding: Asylum Processing Burden Concentration
| Rank | Jurisdiction | Asylees per 100,000 ICE Employees | Asylum Burden Score | ICE Employees | Total Asylees |
|---|---|---|---|---|---|
| 1 | Virginia | 1,206,767 | 60 | 266 | 3,210 |
| 2 | Indiana | 548,077 | 27.3 | 104 | 570 |
| 3 | New York | 522,532 | 26 | 1,864 | 9,740 |
| 4 | Utah | 522,124 | 26 | 226 | 1,180 |
| 5 | Maine | 478,261 | 23.8 | 46 | 220 |
| 6 | Maryland | 467,136 | 23.2 | 426 | 1,990 |
| 7 | Connecticut | 456,140 | 22.7 | 57 | 260 |
| 8 | California | 387,507 | 19.3 | 3,458 | 13,400 |
| 9 | Massachusetts | 338,843 | 16.8 | 484 | 1,640 |
| 10 | Rhode Island | 319,149 | 15.9 | 47 | 150 |
Virginia’s asylum burden ratio is 2.2 times that of Indiana, indicating singular operational vulnerability concentrated in Virginia. The top five jurisdictions collectively manage 14,920 asylum cases with only 2,506 employees.
Note: The ‘5,200 cases / 673 employees’ figures were based on the old top 5, which incorrectly included Alaska. The corrected top 5, Virginia, Indiana, New York, Utah, and Maine, yields 14,920 asylees and 2,506 ICE employees.
Tertiary Finding: Airport Infrastructure Burden Distribution
| Rank | Jurisdiction | Airports per 100,000 ICE Employees | Airport Burden Score | Total Airports | ICE Employees |
|---|---|---|---|---|---|
| 1 | Alaska | 912,903 | 40.0 | 283 | 31 |
| 2 | Kansas | 344,186 | 15.1 | 148 | 43 |
| 3 | Montana | 341,667 | 15 | 123 | 36 |
| 4 | North Dakota | 228,205 | 10.00 | 89 | 39 |
| 5 | Wisconsin | 205,085 | 9.0 | 121 | 59 |
| 6 | South Dakota | 202,941 | 8.9 | 69 | 34 |
| 7 | Iowa | 179,688 | 7.9 | 115 | 64 |
| 8 | Wyoming | 131,250 | 5.8 | 42 | 32 |
| 9 | Idaho | 126,263 | 5.5 | 125 | 99 |
| 10 | Arkansas | 109,890 | 4.8 | 100 | 91 |
Alaska’s airport infrastructure burden is 2.65 times that of Kansas, reflecting geographic constraints rather than operational choice. Collectively, the five highest-ranked jurisdictions (Alaska, Kansas, Montana, North Dakota, and Wisconsin) maintain 764 airports with only 208 employees, forming a secondary crisis zone driven by infrastructure density rather than immigration volume.
Quaternary Finding: Dual-Burden Jurisdictions Facing Converging Operational Pressures
| Jurisdiction | ICE Employees | Asylees | Airports | Asylum Burden Score | Airport Burden Score | Combined Burden Score |
|---|---|---|---|---|---|---|
| Virginia | 266 | 3,210 | 64 | 60 | 1.1 | 61.1 |
| Wisconsin | 59 | 180 | 121 | 15.2 | 9.0 | 24.2 |
| Iowa | 64 | 110 | 115 | 8.5 | 7.9 | 16.4 |
| Kansas | 43 | 50 | 148 | 5.8 | 15.1 | 20.9 |
Four jurisdictions face simultaneous pressures on both operational fronts, preventing resource rebalancing between competing demands and creating distinct vulnerability patterns. These jurisdictions cannot solve capacity constraints through operational reorganization and require either workforce augmentation or responsibility reduction to maintain operational viability.
Quinary Finding: Regional Burden Concentration Patterns
| Region | Jurisdictions | Avg ICE Employees | Avg Asylees | Avg Airports | Avg Burden Score |
|---|---|---|---|---|---|
| Northeast | 6 | 423 | 2012 | 42 | 20.39 |
| Upper Midwest | 5 | 48 | 72 | 108 | 16.6 |
| Border and Southwest | 8 | 1800 | 2942 | 132 | 11.4 |
| Mountain West | 9 | 487 | 240 | 103 | 15.5 |
| Southeast | 10 | 324 | 245 | 77 | 6.2 |
| West Coast | 5 | 841 | 2970 | 155 | 18.4 |
| Great Plains | 7 | 70 | 76 | 96 | 12.1 |
The Northeast leads in asylum processing burden with the highest average score of 20.39, while the Upper Midwest, despite the nation’s lowest staffing at 48 employees per jurisdiction, bears significant airport infrastructure strain. Border and Southwest regions average a burden score of 11.42. The Southeast records the lowest regional burden at 6.24, reflecting proportionate federal deployment relative to operational demand.